
Median Earnings Multiple Spirals Out of Control
According to several analysts at Bank of America Merrill Lynch, a key measure in valuing the stock market has reached levels not seen since the “Dot-Com Bubble” of the late 1990s.
Much like today, the rise of tech stocks in the late 1990s was heralded as a new chapter in growth–that is, until those tech stocks came crashing down. By early 2000, it had become obvious they couldn’t justify such expensive valuations, which led to one of the biggest stock market crashes ever.
Advertisement

Bank of America Merrill Lynch thinks we’ve arrived at that point once again. They point to the price-to-earnings multiple, otherwise known as the P/E ratio. This ratio represents the share price of a stock divided by its earnings per share (EPS). It is a quick and dirty way to measure the value of a stock, but it doesn’t make much sense without comparisons to similar companies. (Source: “Bank of America strategist warns stocks are nearing ‘Tech Bubble’ levels,” Yahoo! Finance, October 11, 2016.)
After all, some types of stocks trade at P/Es and others trade more conservatively. You can only know if one stock is particularly overpriced by comparing it to its peers. Even then, there’s no guarantee the ratio is telling you something certain.
That being said, looking at all P/E ratios on the market can be very useful. The “median P/E” ticks up or down, depending on the level of optimism investors have about the future. So when it gets dangerously high, there’s good reason to believe a stock market crash is on the horizon.
Take a look at the following chart:
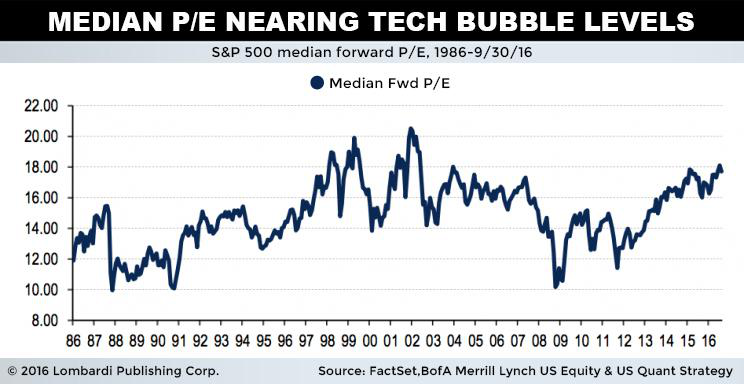
While the average P/E is still shy of critical levels, the median values have risen to alarming rates. The analysts at Bank of America Merrill Lynch believe this is because there are a greater number of overvalued companies on today’s stock market.
“The S&P 500 median P/E is currently at its highest levels since 2001 and suggests that the average stock trades a full multiple point higher than the oft-quoted aggregate P/E,” said Bank of America Merrill Lynch’s Savita Subramanian. “This puts it in the 91st percentile of its own history and just 14% from its Tech Bubble peak.”
Subramanian’s warnings are particularly worrisome in light of lowered earnings estimates that come without a corresponding move in stock prices. As a consequence, the median P/E could continue to rise, thus bringing the bubble closer to its breaking point.